Distributed monitoring system for controlling quality of broadcasting services
This is a complex system of automated distributed monitoring and real-time quality control of provided TV and radio broadcasting services.
It is a flexible and scalable complex for controlling TV-signal metrics and monitoring the quality of provided service. The complex is made up of analyzer units (probes) for collecting metrics and a central core system which provide the ground for determining signal delivery status to targeted users in accordance with preset logical rules.
Demo access to the system will be provided following an inquiry via WEB interface.
MultiProbe features a wide range of functions covering all needs for monitoring broadcasting services both by communications providers (cable, satellite, wireless, OTT, others) and TV companies of any caliber.
Intended Use
- Real-time monitoring of provided broadcasting service
- Visual and instrumental parameter check of any entity in the media production chain
- Complex infrastructure monitoring
- Analysis and reporting
Application Field
The system is widely used for complex monitoring of all stages of media production and it can be used with clients of any scope:
- Providers of linear TV broadcasting (satellite, wireless, cable)
- TV and radio companies of any scope of operations
- Providers of OTT services and of IPTV broadcasting
- Signal distributors
- Facilities for inserting advertisement and regional side bars or “crawling lines”
Architecture
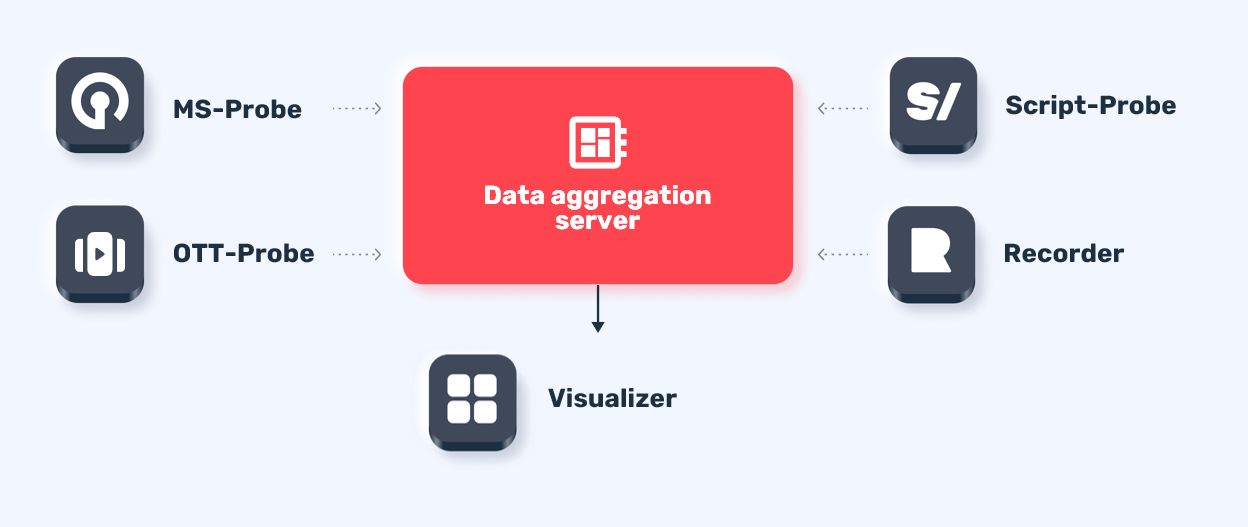
Program solution features a distributed system consisting of analyzer probes and a unified data collection center for consolidating information and its output to the user’s personalized interface as a specially prepared presentation.
System Components:
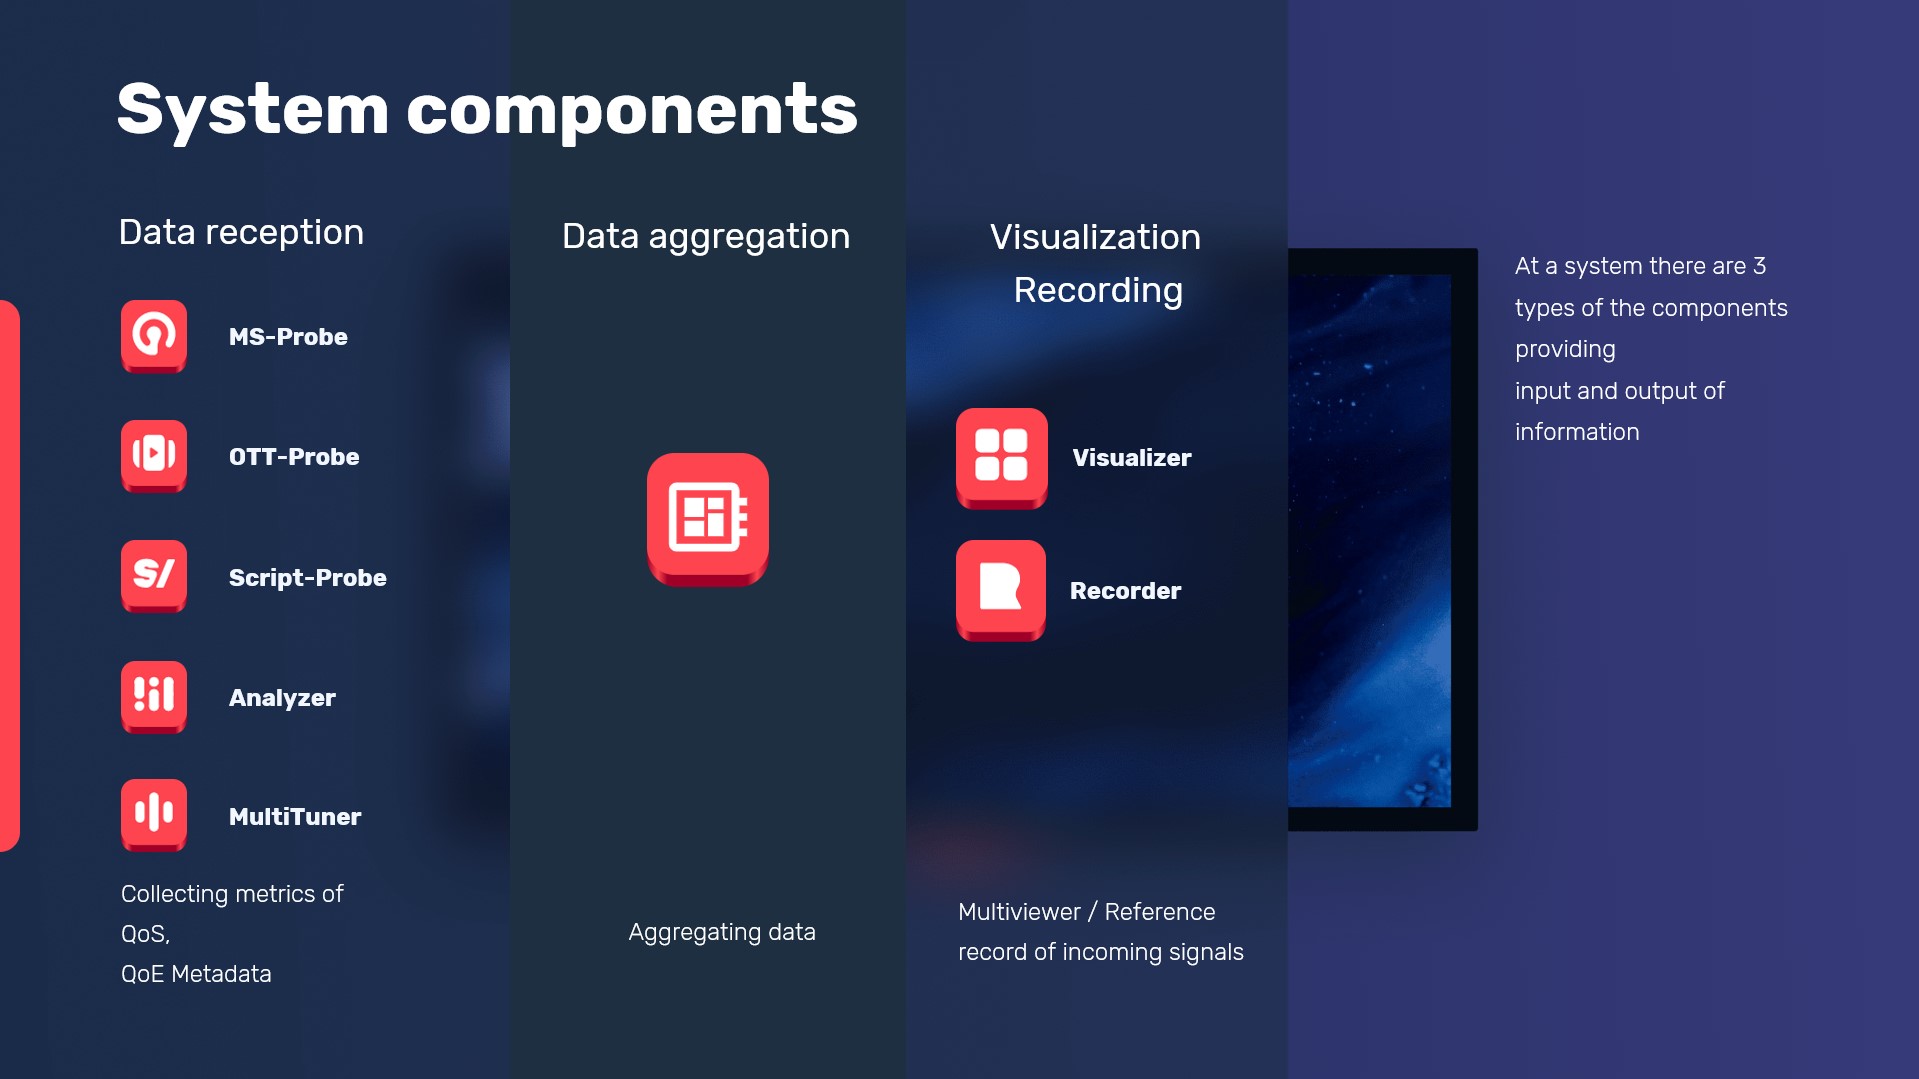 There are three types of components in the system which provide input and output of information:
- Data import (data input)
- Aggregation (storage and analytics)
- Visualization/Recording (data output)
Beside using internal service facilities of the system, data can be sourced from such hardware analyzers as Stream Labs Analyzer and MultiTuner.
Data Import:
MS-Probe – is a system component which provides the collection of service quality metrics and the presentation of media signals and traffic streams.
This component supports the following types of formats and interfaces
- SDI (SD/HD/UHD)
- ST 2110
- ST 2022-6
- CVBS/HDMI
- SRT
- NDI
- UDP/RTP
- RTSP/RTMP
- T2-MI
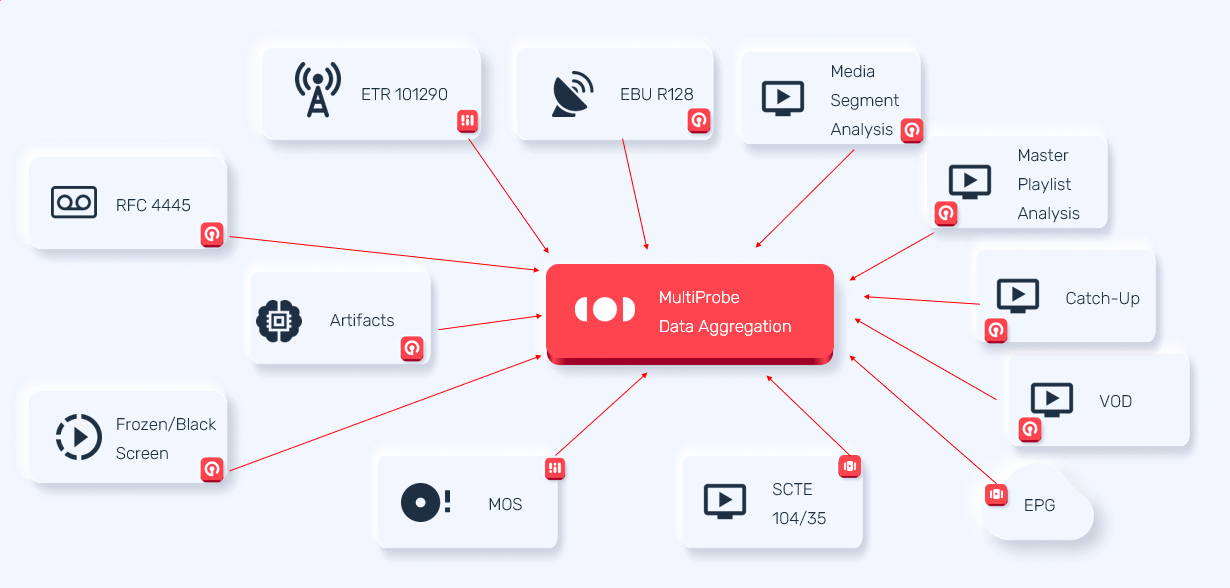
MS-Probe uses more than 100 metrics for assessing signal quality, including following types of measurements and specifications:
- QoS: ETR 101290, RFC 4445
- QoE: Artifacts/Macroblocking, Frozen/Black Screen, MOS, EBU R 128
- Metadata: Teletext, Subtitles, SCTE 104/35, EPG
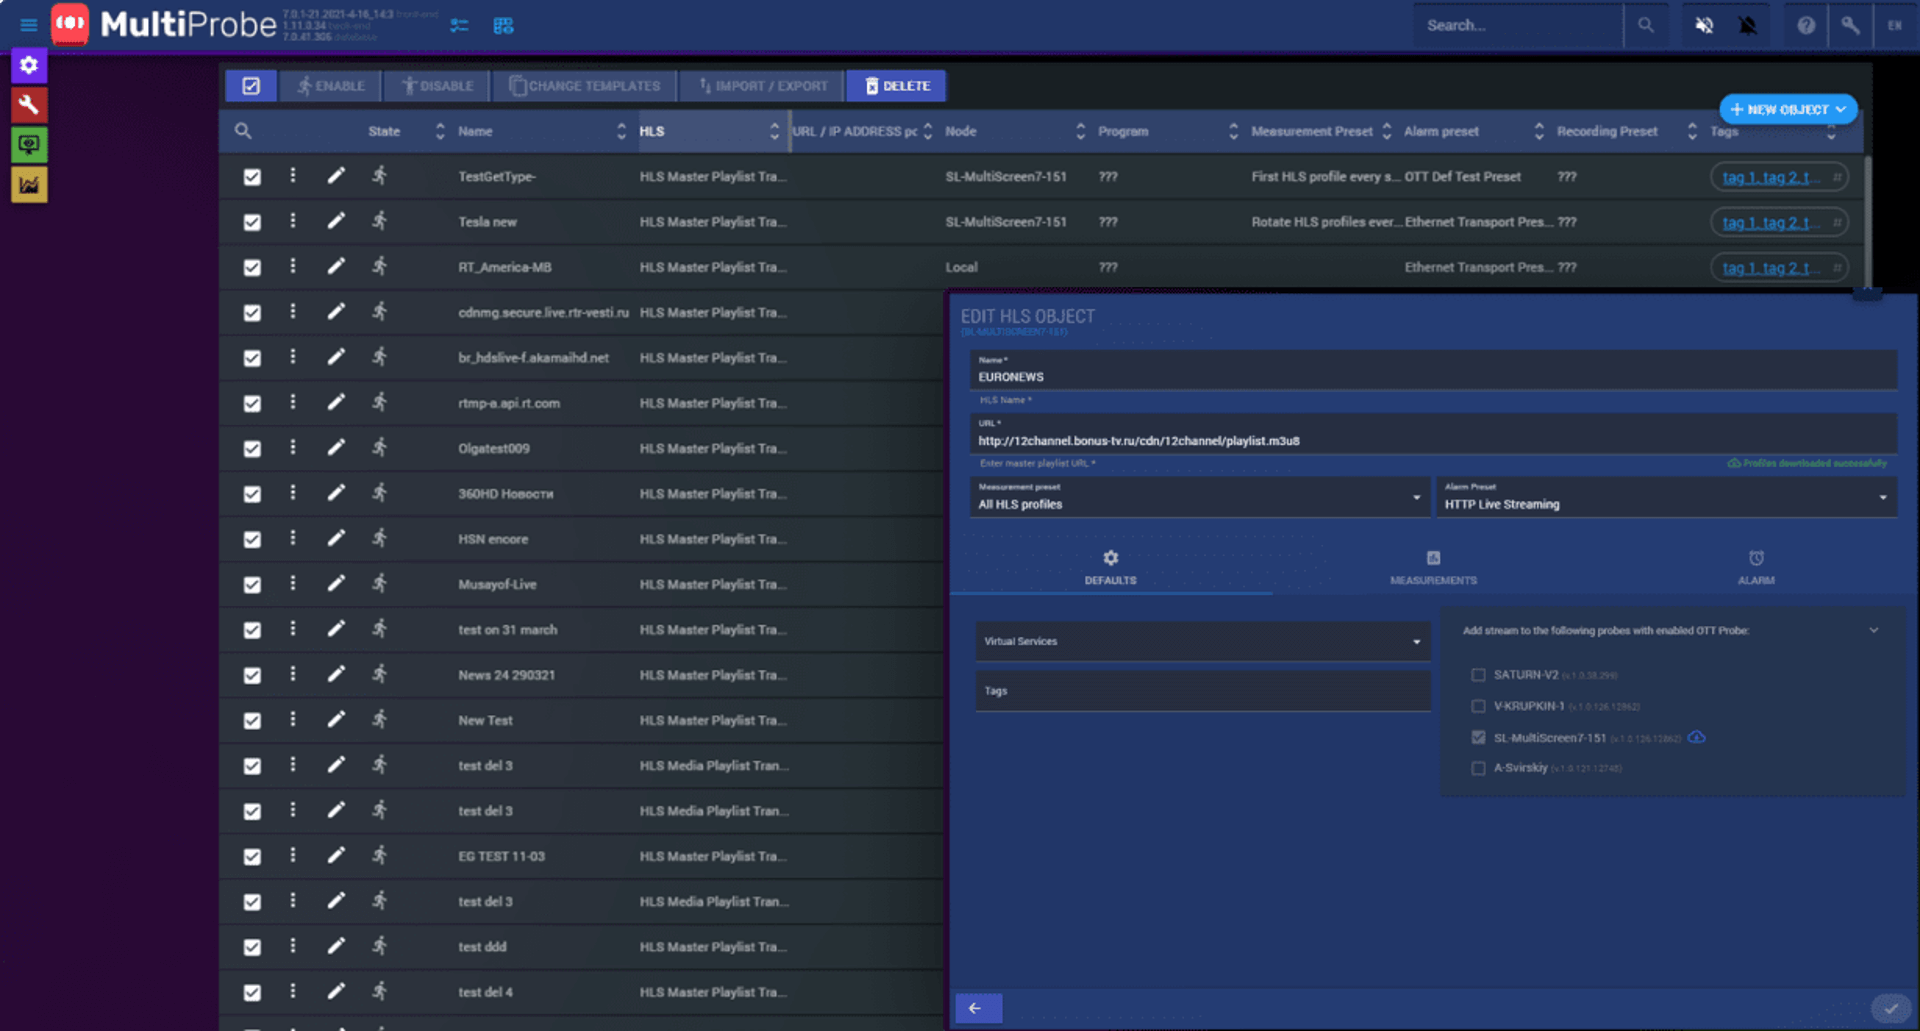
OTT-Probe – is a system component providing the collection of service quality metrics and the presentation of OTT services.
This component supports the following types of formats and interfaces
- HLS
- MPEG-DASH
OTT-Probe provides the following measurements:
- Analysis of parameters and content for a master playlist (manifest)
- Analysis of parameters and content for a media playlist
- Analysis of parameter and content for media segments
- Checkup of content accessibility and storage depth for:
- Catch-UP
- VOD
Script-Probe – is a system component intended for importing data from outside facilities or systems.
Data input is provided using user-generated scripts. The service uses pre-installed evaluators for interacting with scripts, and Script-Probe uses IP-address and information input protocol. The system gathers various metrics and translates them into the aggregation module for further analysis.
This system component helps control status changes of infrastructure objects and systems. That is, the MultiProbe system makes it possible, beside controlling signals, to monitor the hardware and the infrastructure in general.
All types of facilities with open interaction protocols are supported:
- Switches
- Reservation units
- Splitters
- Logo inserters
- Coders/Decoders
- Multiplexors
- Routers
- etc...
It is possible to receive data and, using it, to create assets from any API system:
- Traffic systems
- MAM
- Broadcasting servers
- Billing systems
- CAS/DRM systems
- EPG servers
- etc...
All types of equipment are supported as well as all systems that support open-protocol interactions:
- REST
- JSON-RPC
- Requests over Telnet and SSH
- SNMP
- etc...
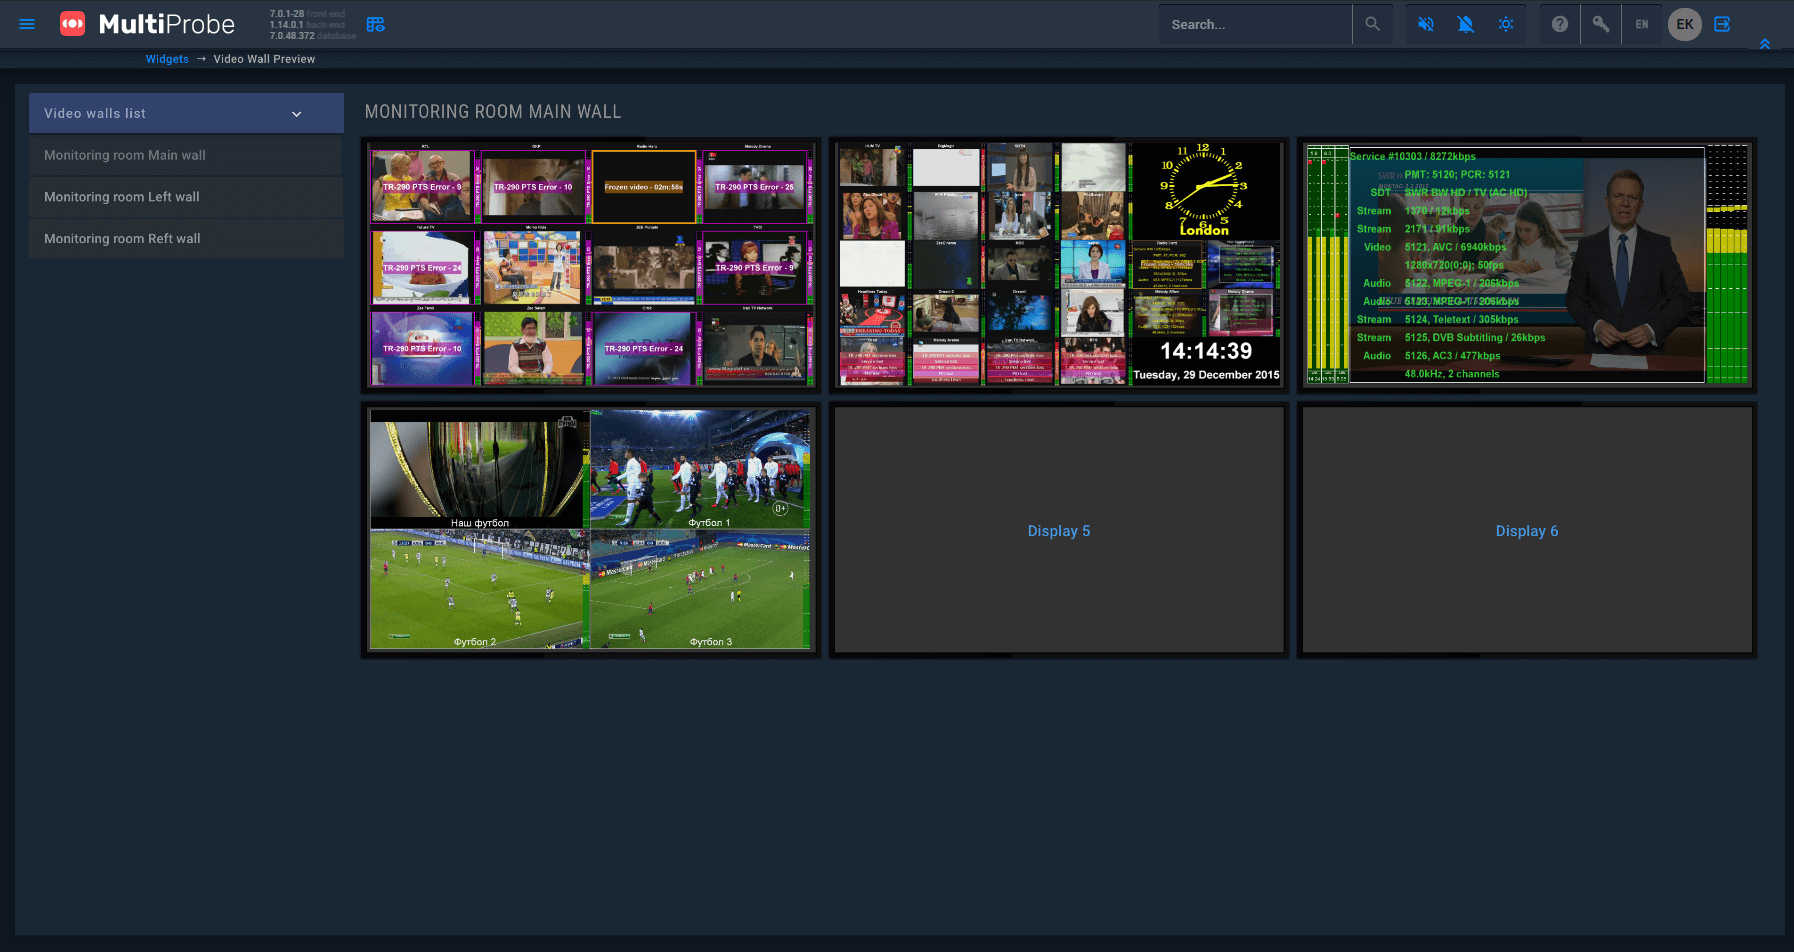
Visualization and Recording:
Visualizer – is a system component providing creation of dynamic or static visualization via presentation interfaces.
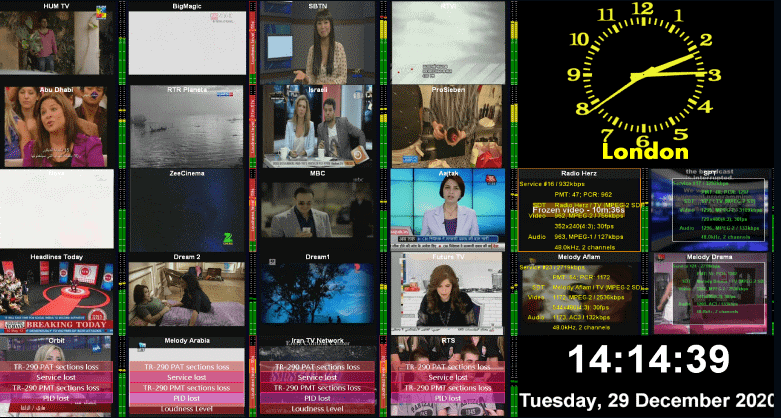
- Flexible system for creating dynamic visualization from remote monitoring points
- Centralized programmed output of collected video streams to videowalls and to the WEB interface
- Encoding mosaic for translation to local and public networks
- Direct video output, with minimal delays, via HDMI/DP/DVI
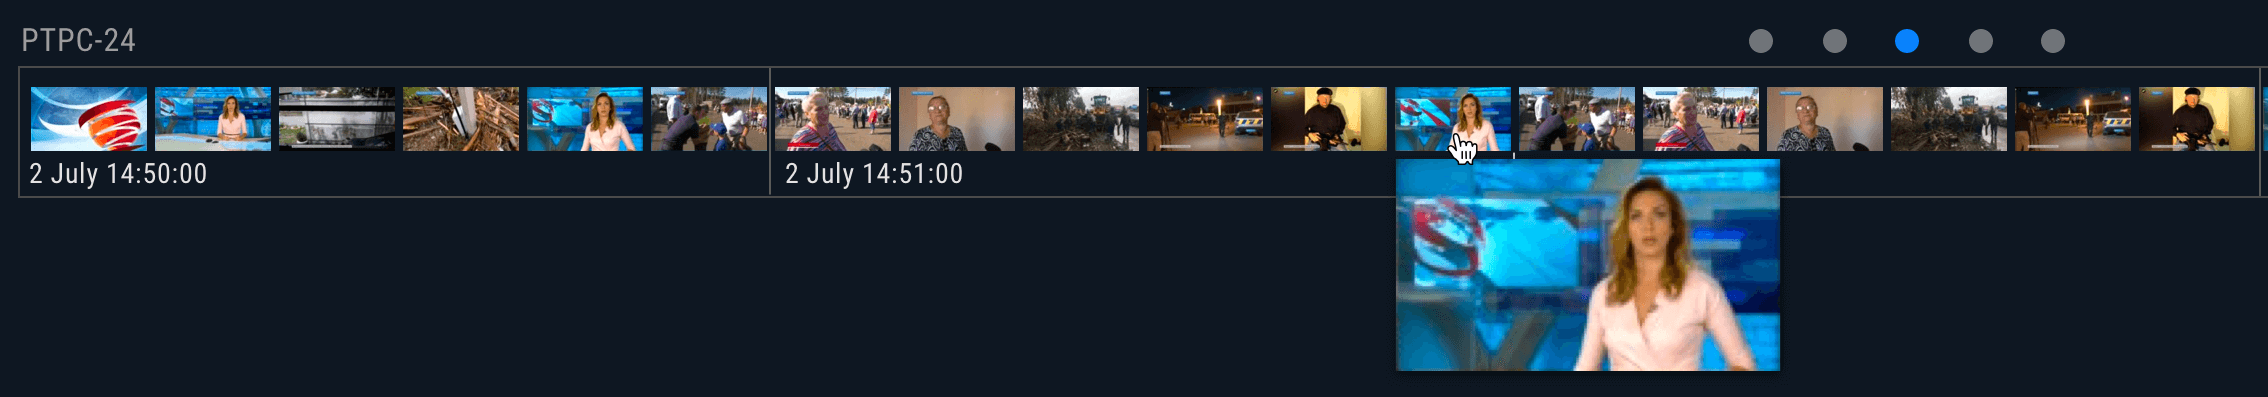
Recorder - is a system component intended for recording signals coming from different sources that are deployed for monitoring purposes.
- Recording source streams
- Broad choice of transcoding configuration
- Metadata burning
- Scheduled recording and by alarm events
Aggregation:
- Providing import and storage of data from all probes
- Data storage and analysis
- Status creation and presenting values received from monitoring sites
- Site status
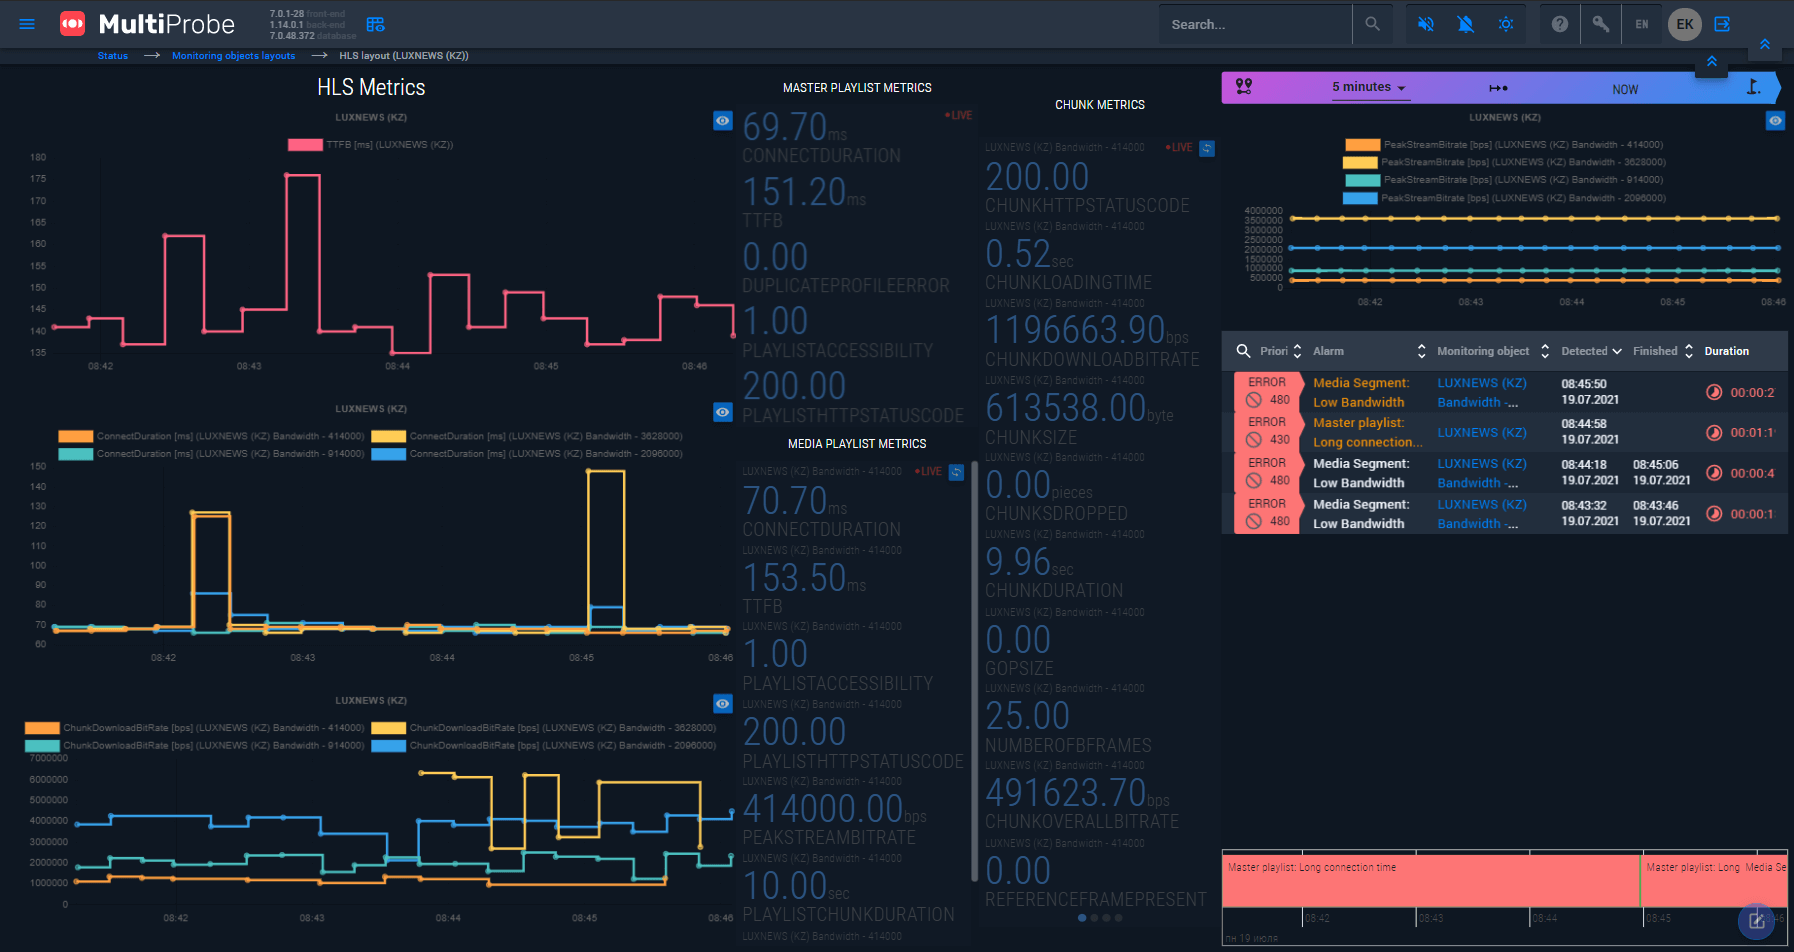
- Metrics visualization using graphic charts and diagrams
- Change statistics
- Creating alerts and reports
- Data correlation
- Working with virtual service correlation objects
- Transmission channel graph plotting and visualization
- SLA measuring
- Using machine learning for artefact search and statistics analysis
Key Functionality:
- Controlling of total service provisioning
- Visualizing the delivery channel of provided service
- Possibility of a low-cost, but effective monitoring (round-robin)
- Batch-mode addition of monitoring sites and their customization
- Individual user presentations
- Fully customizable interface templates
- Options for real-time viewing of signals coming from any site, not only in WEB, but also on the videowall
- Support for data input from and output to external systems using open protocols
- Monitoring subscriber hardware
- Optional use of hardware capabilities for coding and decoding data streams
Product Features:
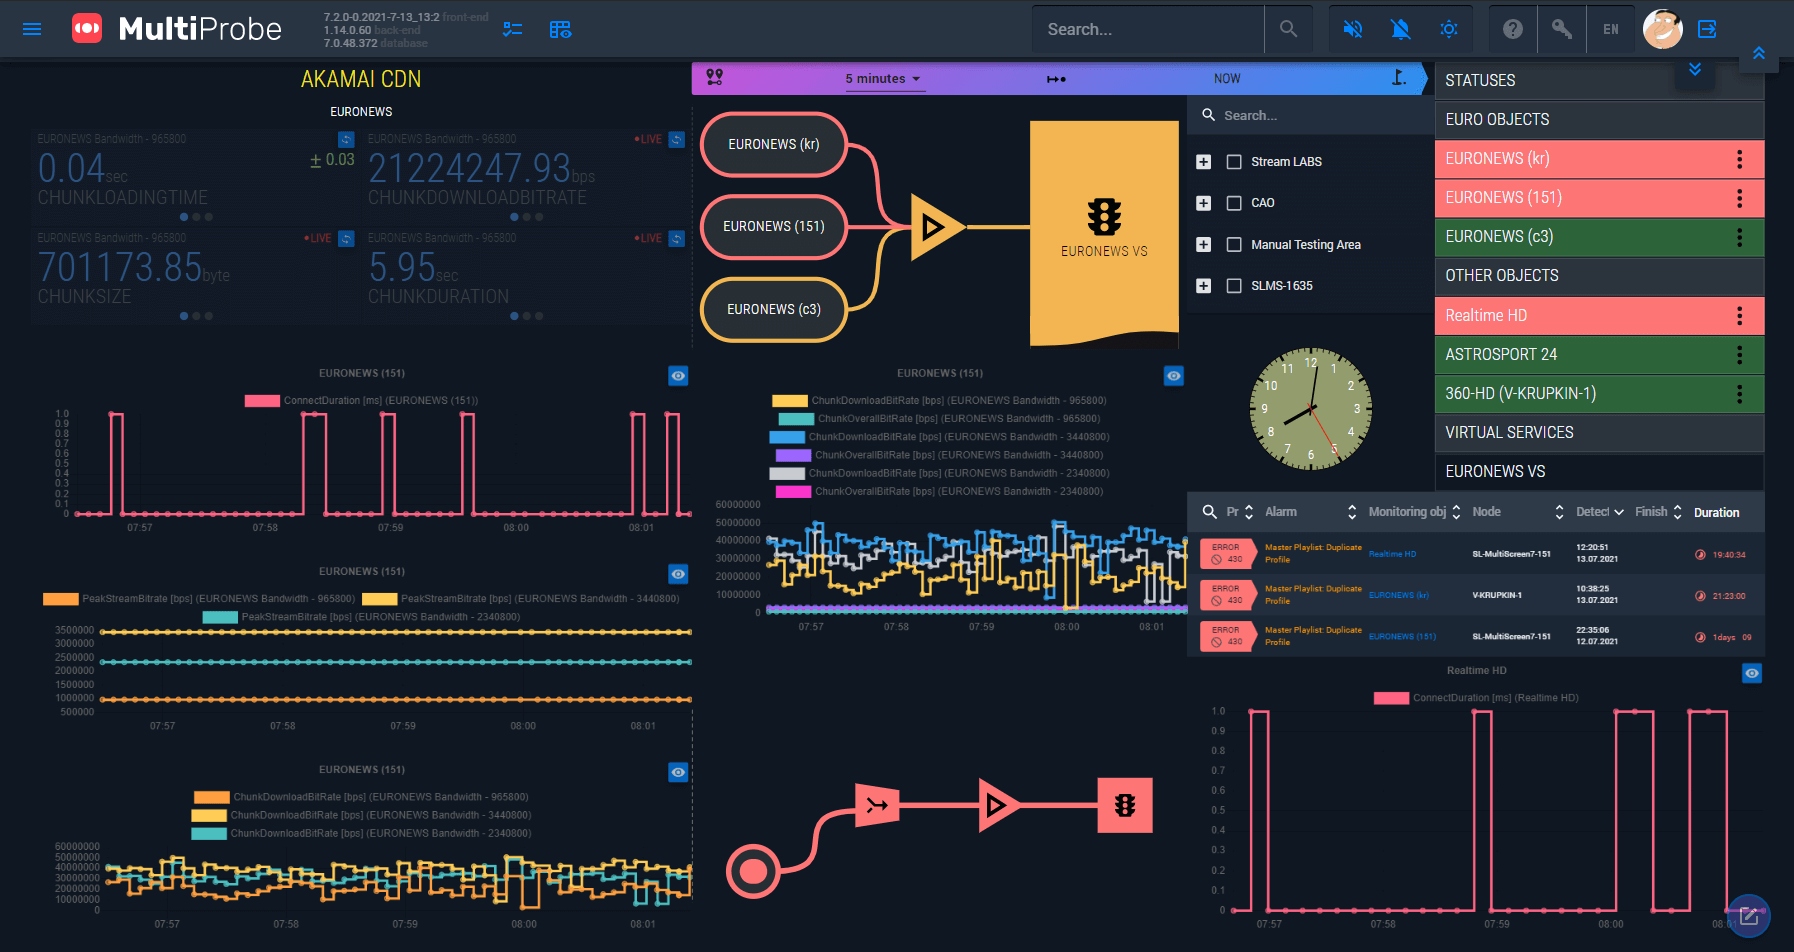
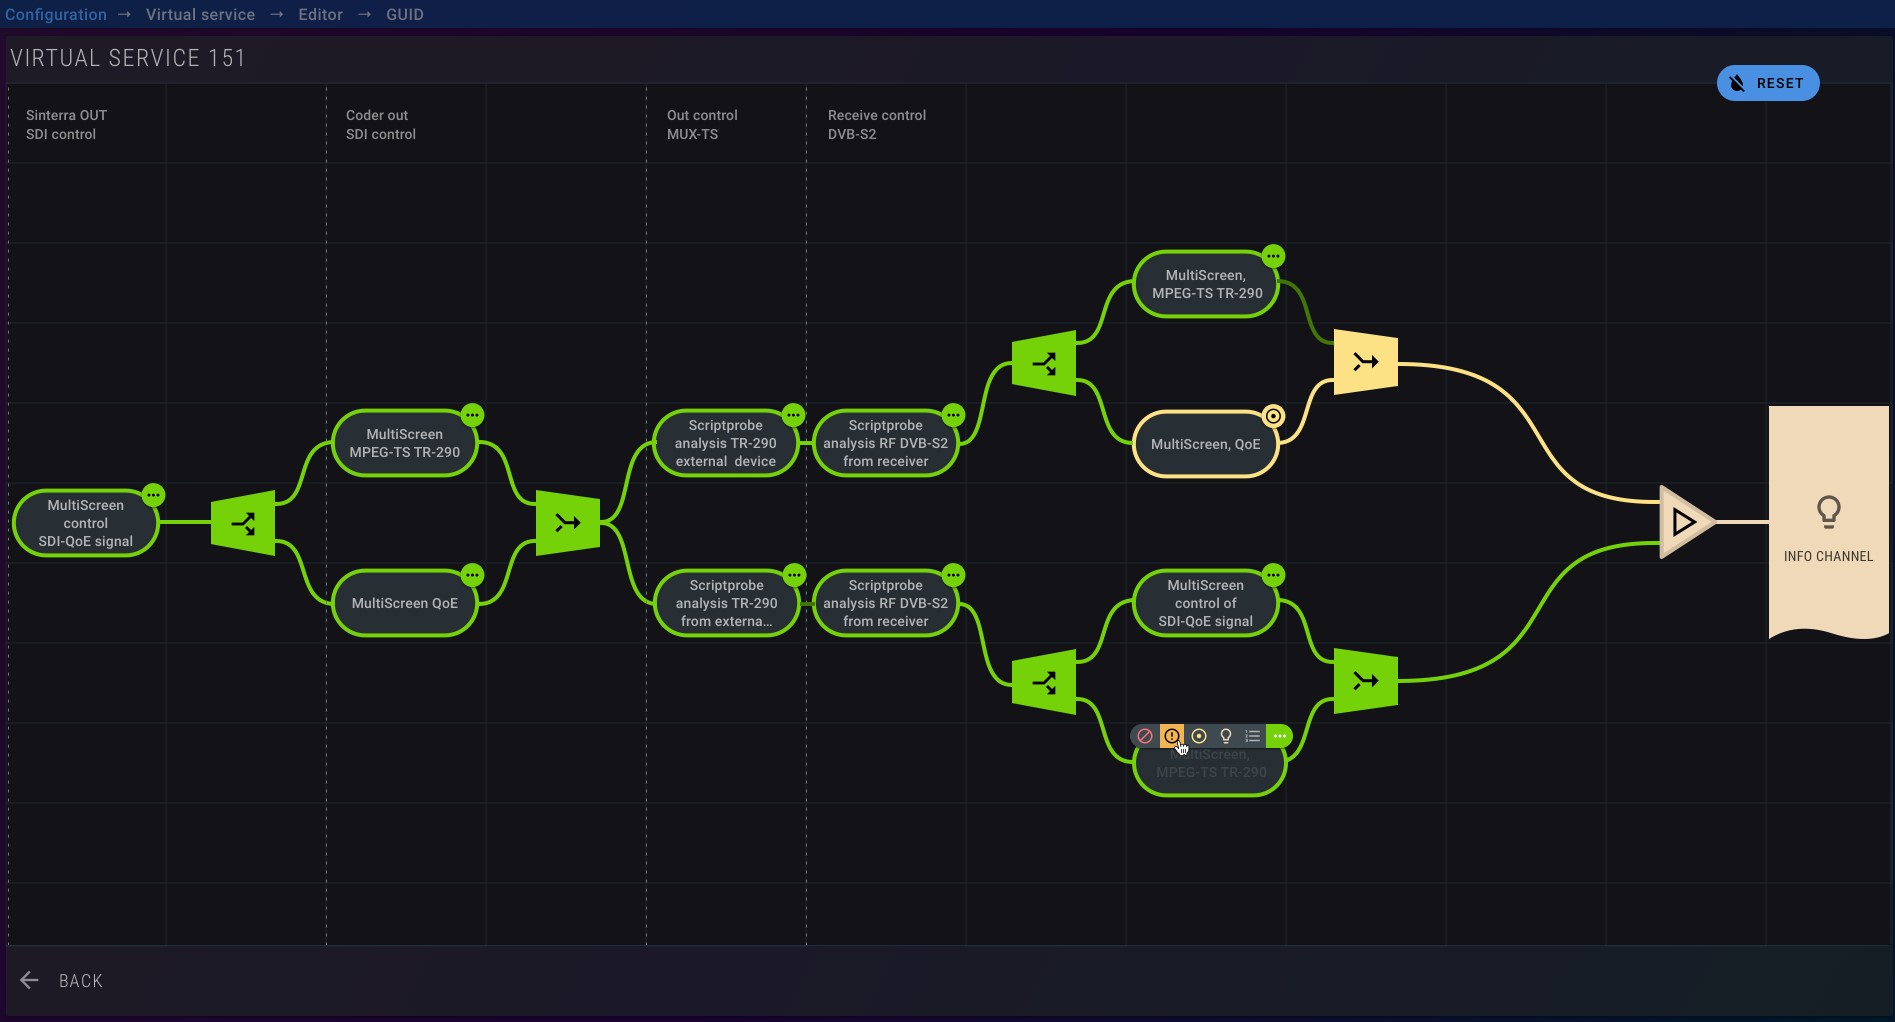
Virtual correlation services
The system allows for operating with upper-level monitoring objects which are represented as virtual providers of “services” that can be assessed in terms of their status by configuring the interrelation of monitoring objects, those that have their status constantly monitored.
«Virtual Service» - is an entity the status of which is defined by the function of such monitoring objects that make up this entity.
- Service status control
- Channel visualization
- Customizable correlation of object statuses
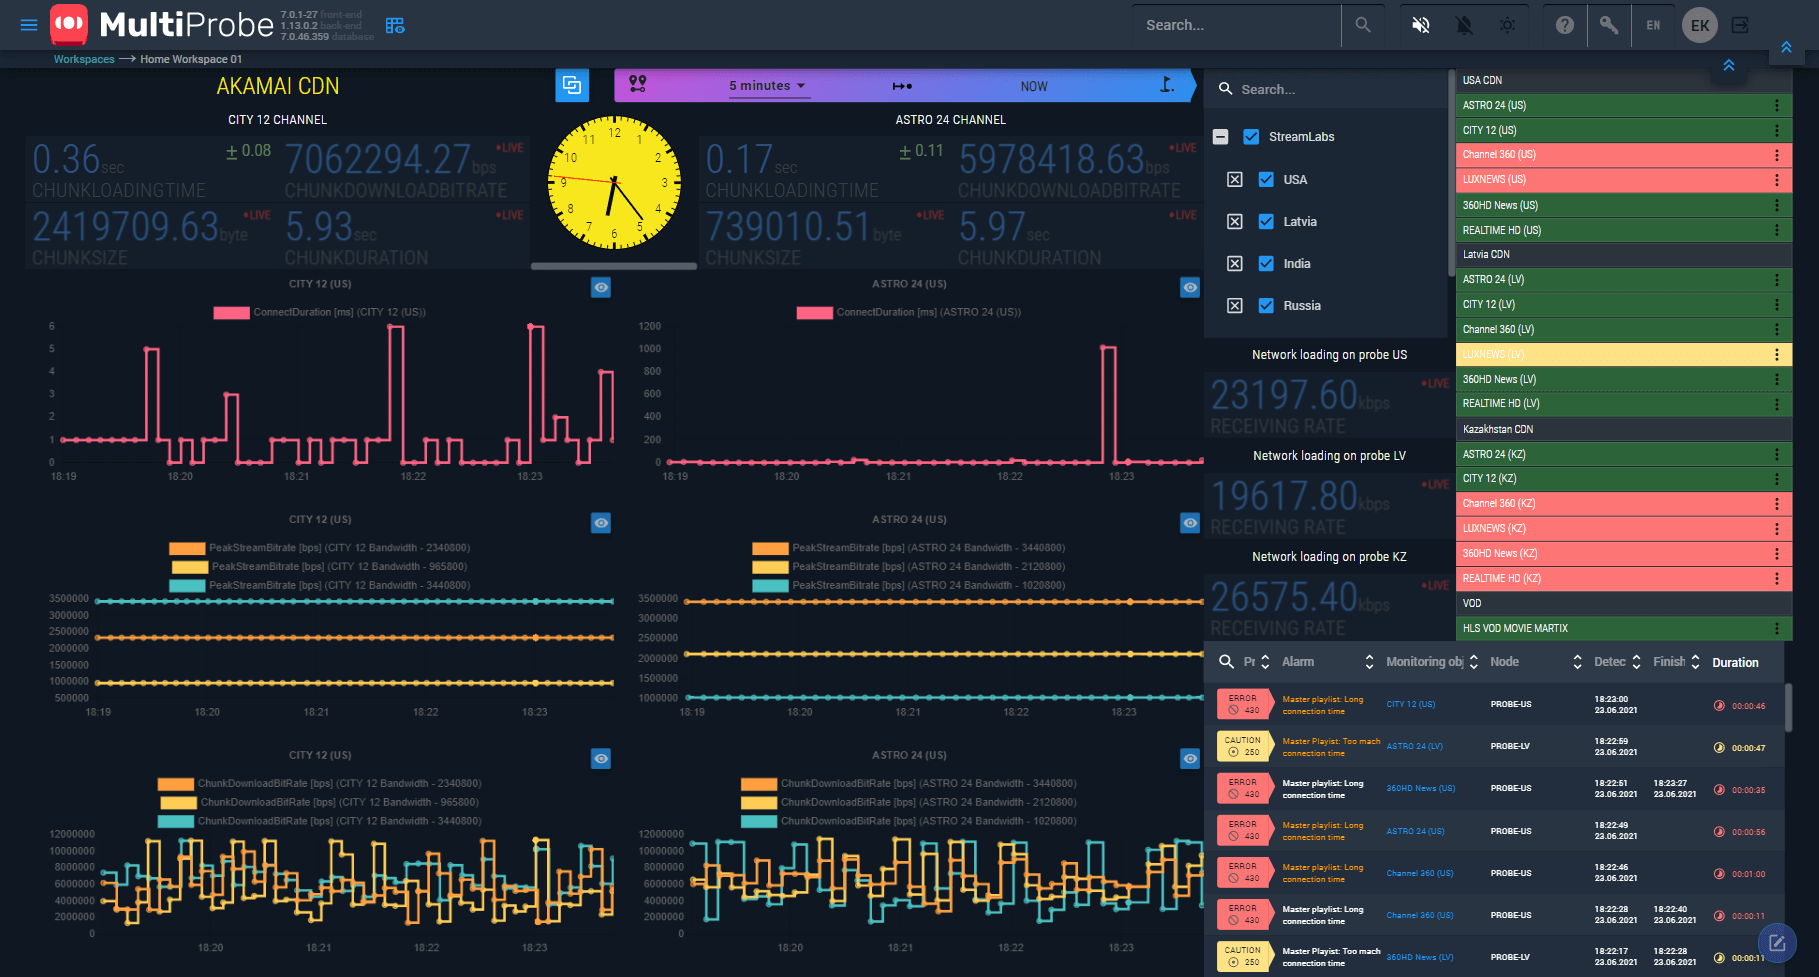
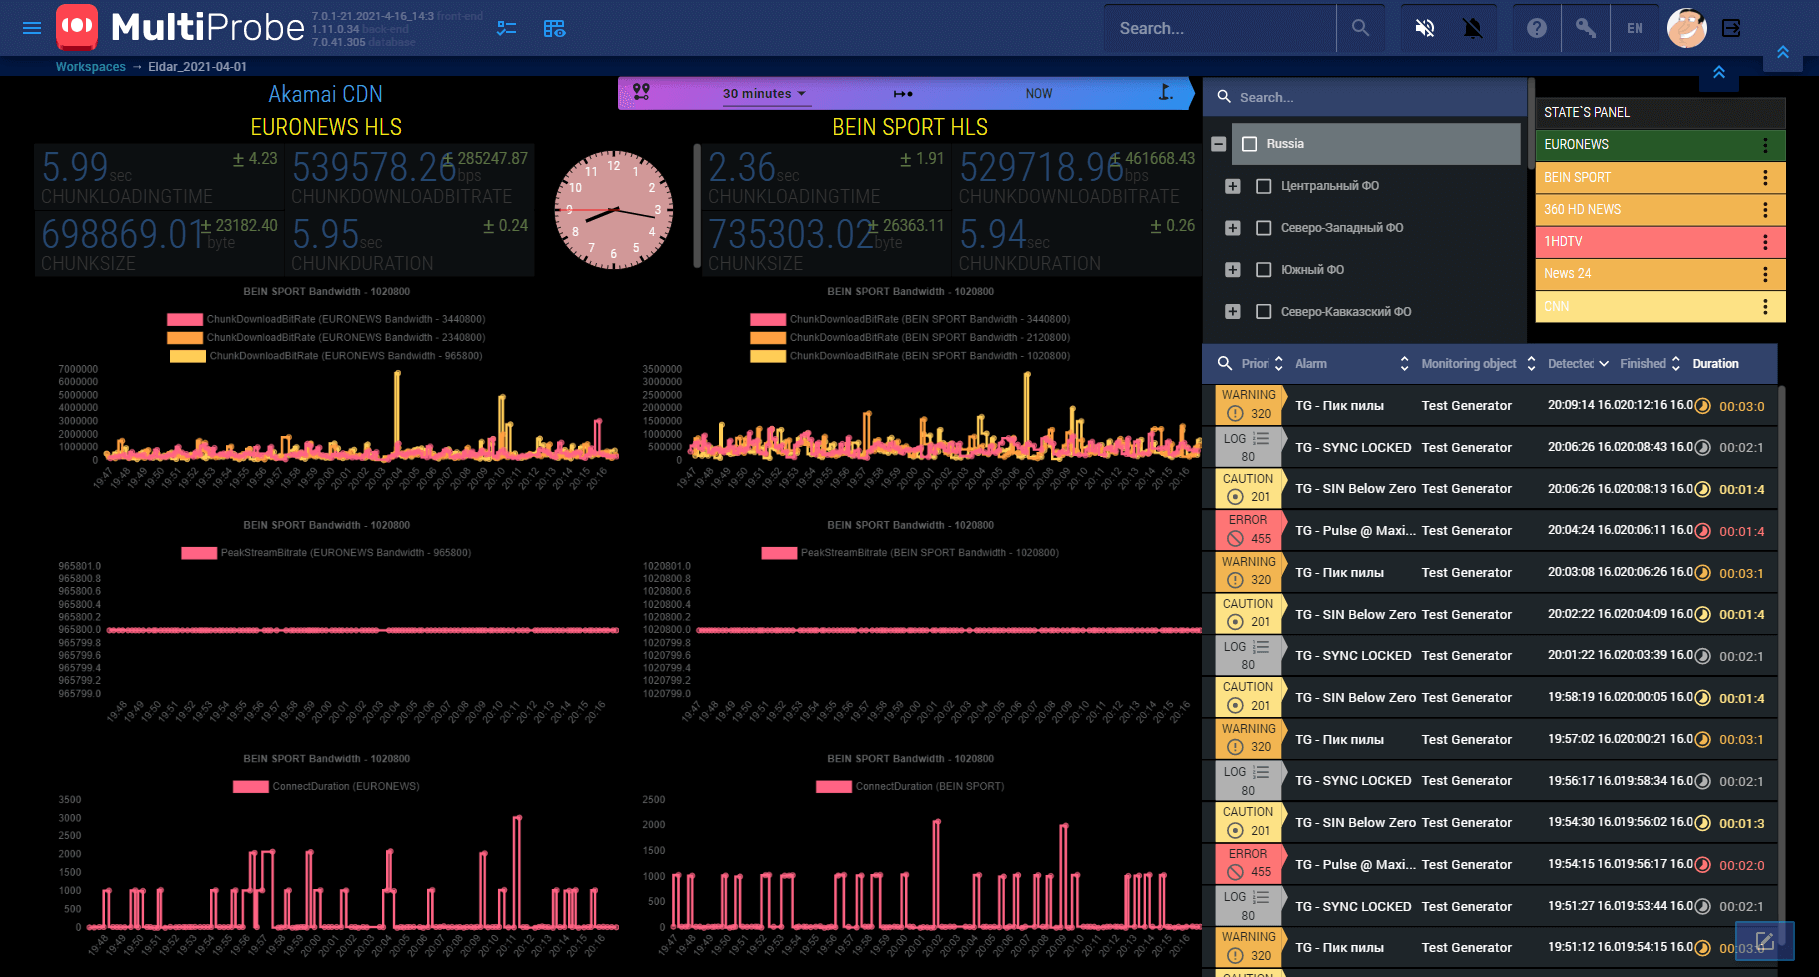
User working spaces
A special feature that characterizes MultiProbe system is its focus on the rank-and-file user. Since the system can be fully configured in accordance with own needs, operating any of the product component is an easy and enjoyable task. User desktops allow the creation of a combined single presentation during the process of controlling any objects. Main page of the system is made up of desktops which a user must create and configure for himself. The desktop itself is presented as a space with widgets located in a pattern which is comfortable for the user.
- Object status panels
- Value indicators
- Diagrams of mean values
- Graphic charts
- Location and time filters
- Vidgets of preview images
- Dissemination paths
- Date and time widgets
- etc...
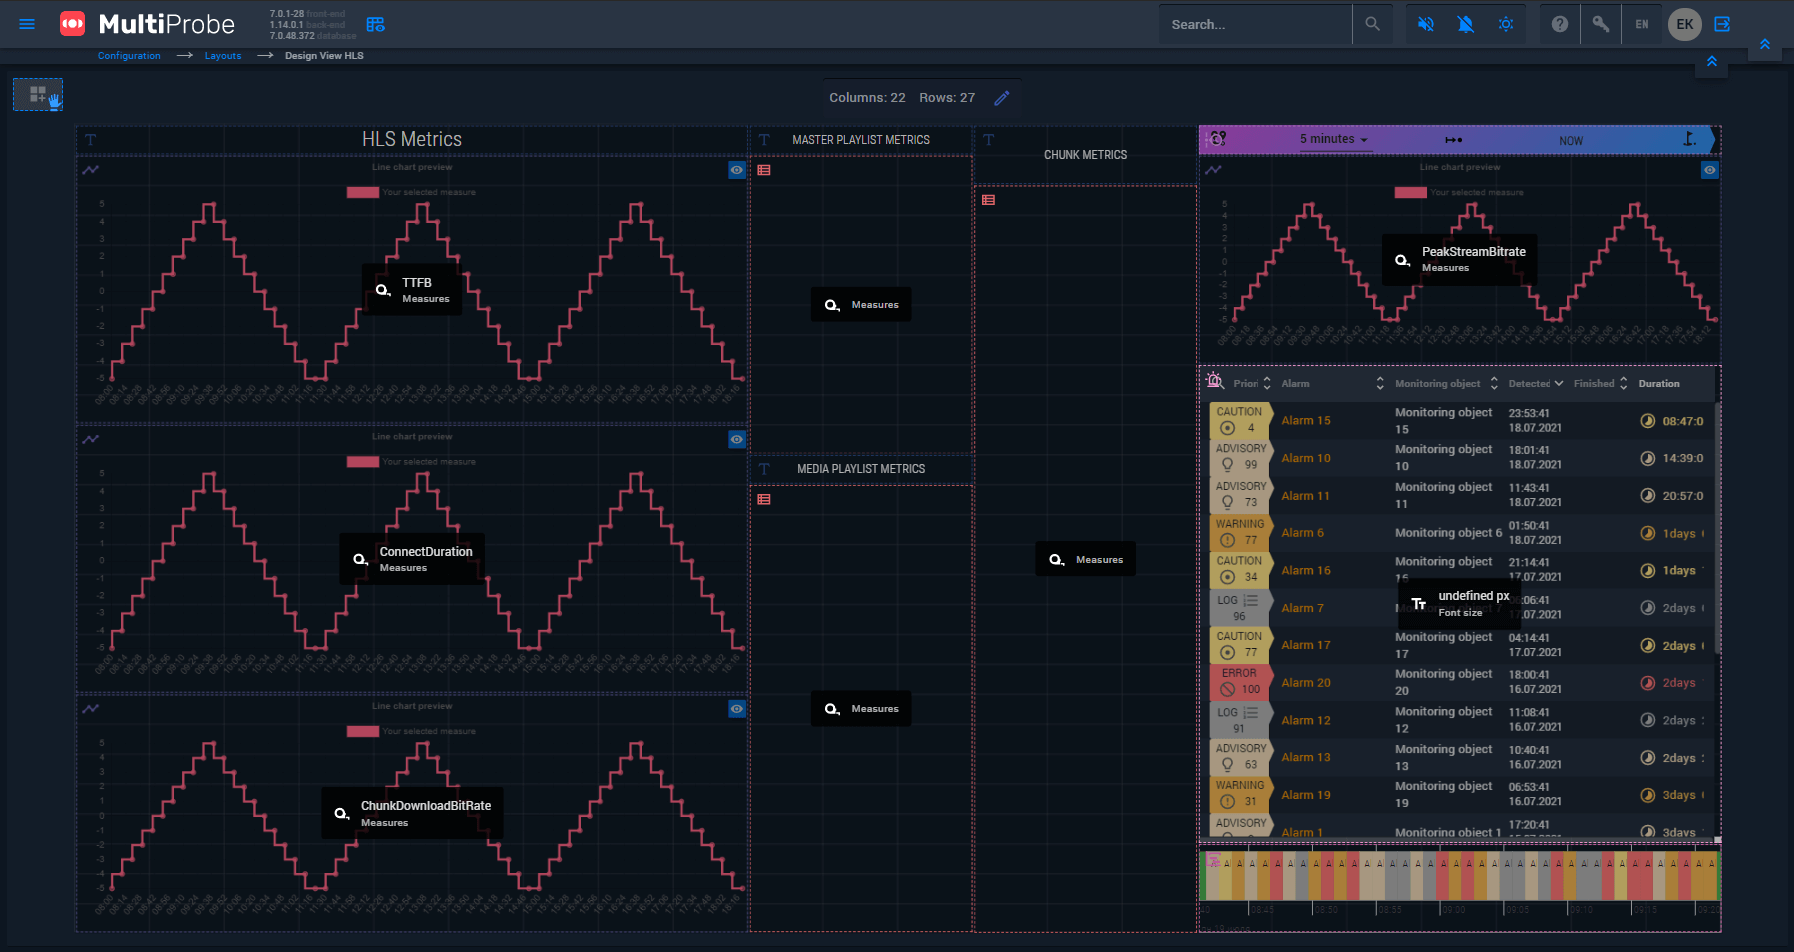
Configurable object presentations
If necessary, any of the object presentation pages in the system can be shown in a different view due to built-in presentation editor. Using all graphic components that are available in the system, complex admin can configure such a presentation for other users which they would like better.
Batch operations
With available use of batch operations, the system does not present problems for users if a large numbers of objects must be configured. The whole MultiProbe system is set up to operate with lists that contain searching, sorting and filtering tools, as well as possibilities for configuring available templates to highlighted objects.
This solution allows for a drastic reduction of config period and further system reconfiguration. This functionality allows also for a quick further adjustment of the complex when more sites are added due to the increase of the number of analyzer probes.
In the same vein, all users are gathered in groups so that overall access and alert configurations can be implemented, and corresponding role templates are applied to these groups, with different rights for accessing system locations and segments.
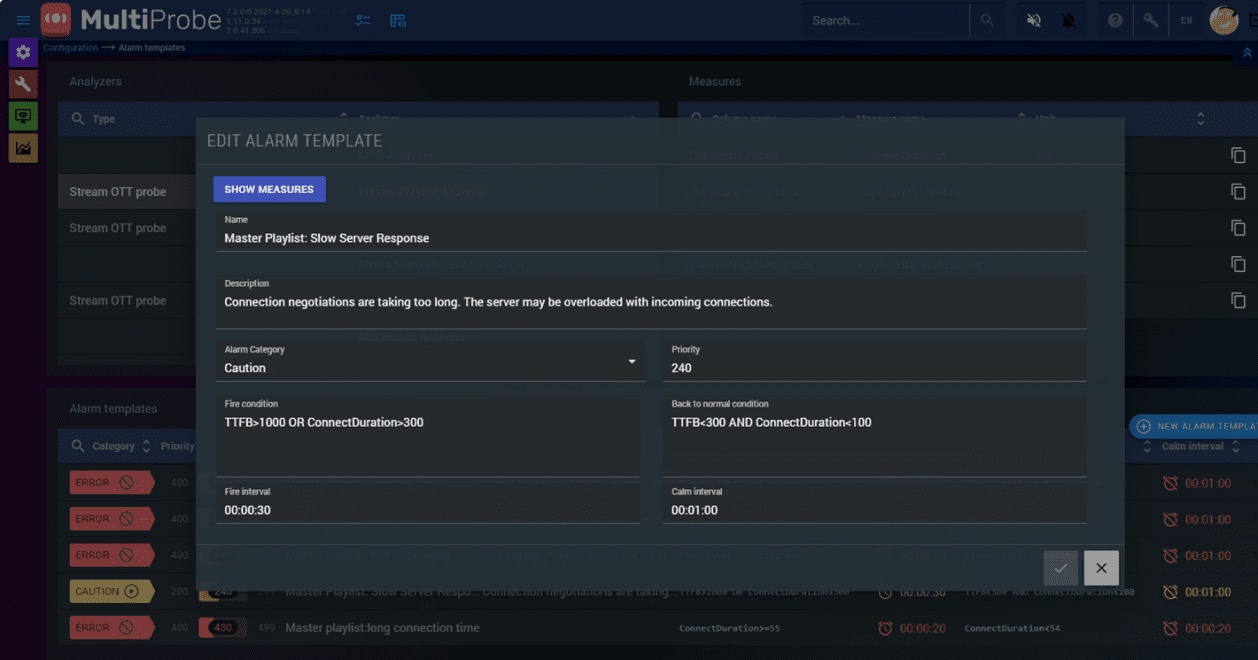
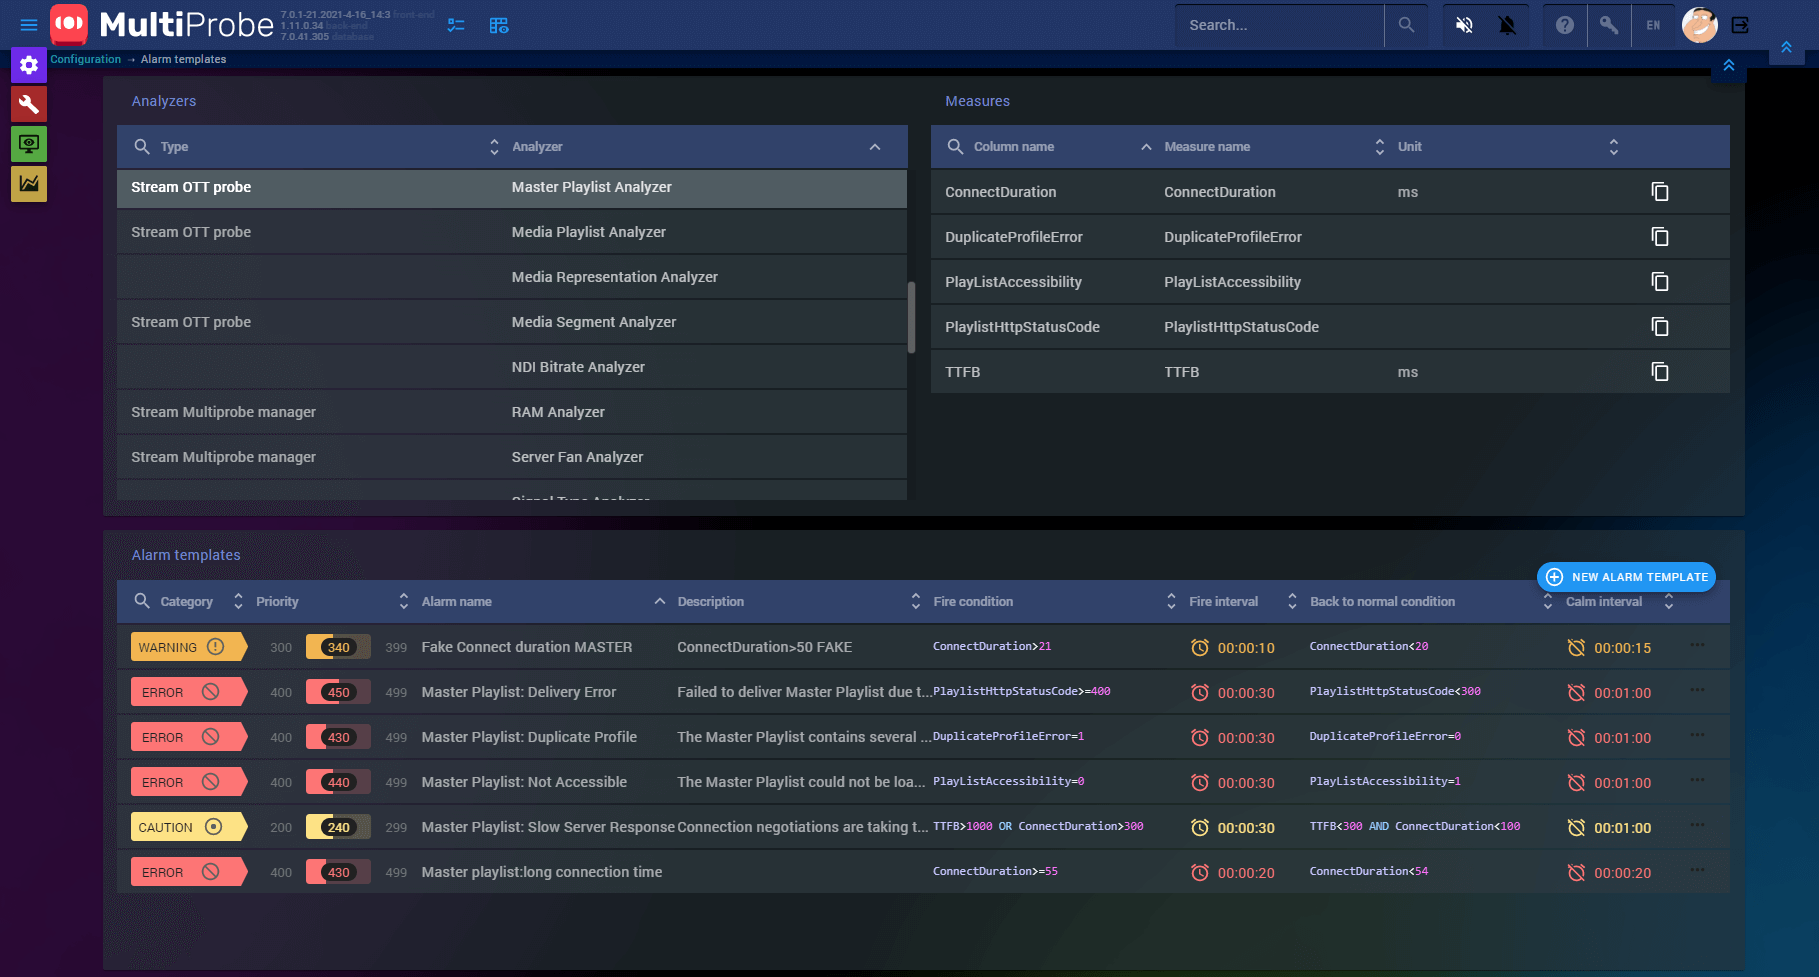
Alarm event templates
This system allows for both using default templates of alarm events and creating own templates out of available user triggers.
While a trigger is formed, the system defines logical predicates, which helps configuring several triggers to react to one alarm event, following different metrics of monitored objects.
The system allows the use of the same metric in different templates, with differing priority settings.
Technical Specifications:
Supported interfaces:
- 3G-SDI (SMPTE-424M, 10 bit, 3 Gbit/s);
- HD-SDI (SMPTE-292M, 10 bit, 1,5 Gbit/s);
- SD-SDI (SMPTE-259M, 10 bit, 270 Mbit/s);
- 12G UHD-SDI (SMPTE ST-2082, 12 Gbit/s);
- UHD Quad-link 3G-SDI
(SMPTE ST-425, 4 x 3 Gbit/s); - DVB-ASI (ETSI EN 50083-9)
Bitrate range 0..214 Mbit/s; - HDMI
- Composite (NTSC, PAL, SECAM);
- Analog (NTSC, PAL, SECAM);
- AES/EBU (24 bit/ 192 kHz) channels;
- IP/Ethernet (ETSI TS 102 034);
- DVB-T/T2 (ETSI EN 300 744,302 755);
- DVB-S/S2 (ETSIEN 300 421, EN302-307, EN301-210);
- DVB-C/C2 (ETSI EN 300 429 Annex A/B/C).
Media containers:
- MPEG-2 TS (ISO/IEC 13818-1), MPTS or SPTS;
- DVB T2-MI Streams (ETSI TR 101 290-1, А14-1).
Supporting network and OTT broadcasting protocols:
- FLASH (1889, 2326, 3550);
- MPEG-DASH
- RTMP streams (Real Time Messaging Protocol).
H.264 - AAC and MP3 streams; - MMS&MMSH
Microsoft Media Server Protocol & MMS over HTTP; - RTSP (RFC 1889, 2326, 3550)
- HLS (HTTP Live Streaming Monitoring);
- NDI (NewTec)
- SRT (Haivision)
- SDI over IP (SMPTE 2022-6)
- SMPTE 2110
Video codecs:
- MPEG-1 (ISO/IEC 11172-1);
- MPEG-2 (ISO/IEC 13818-1);
- MPEG-4.2 (ISO/IEC 14496-2);
- MPEG-4.10 (H.264, ISO/IEC14496-10);
- HEVC (H.265) up to 4K;
- JPEG 2000.
Audio codecs:
- MPEG-1 Layer II (ISO 11172-3);
- Dolby Digital (AC-3, ATSC A.52b);
- AAC/ADTS/ADIF (ISO/IEC 13818-7, ISO 14496-3);
- SMPTE 302M.
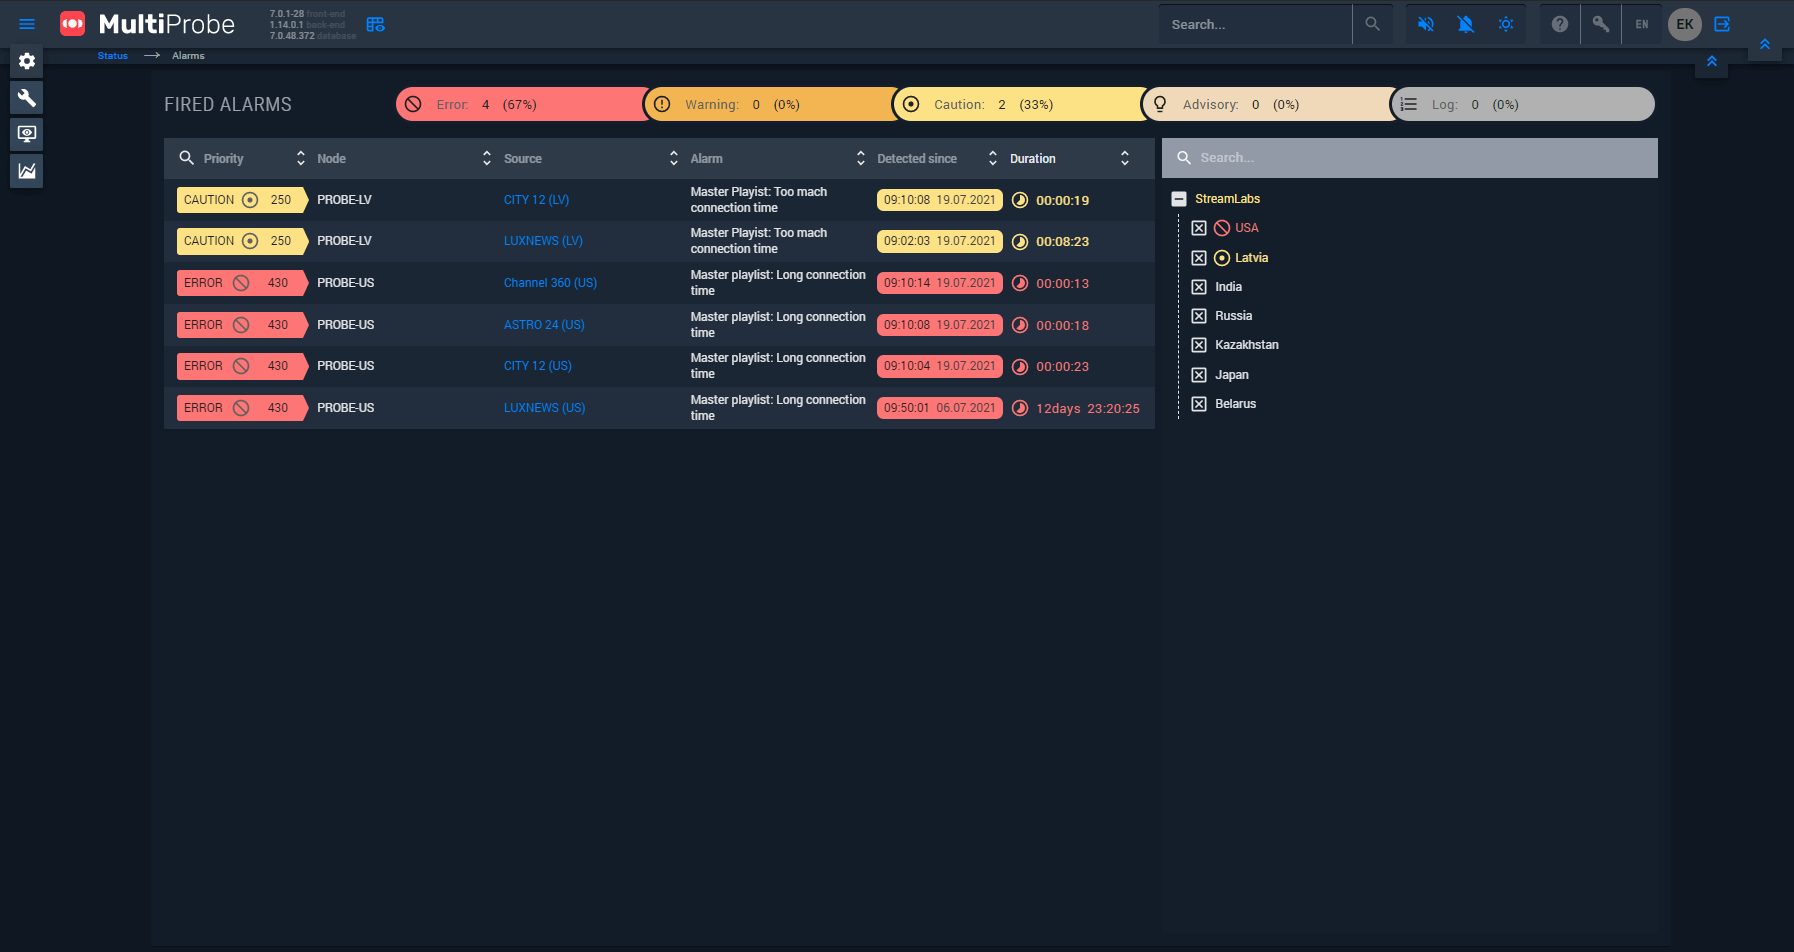
System Interface:
Desktop user interface example
Alarm events configuration
Alarm events visualization
Videowall configuration